
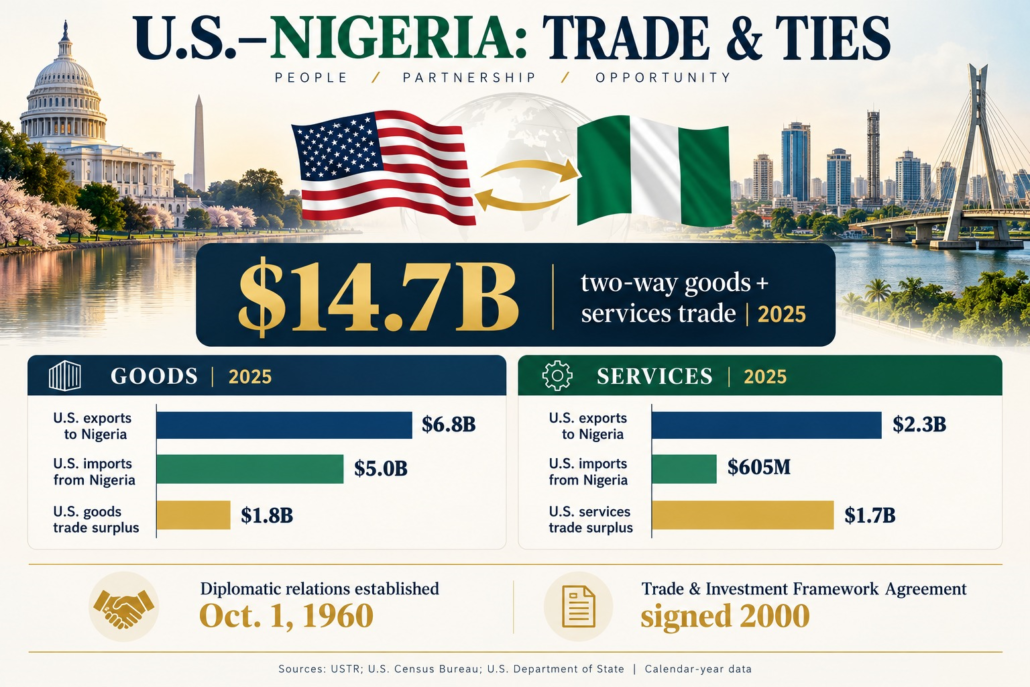
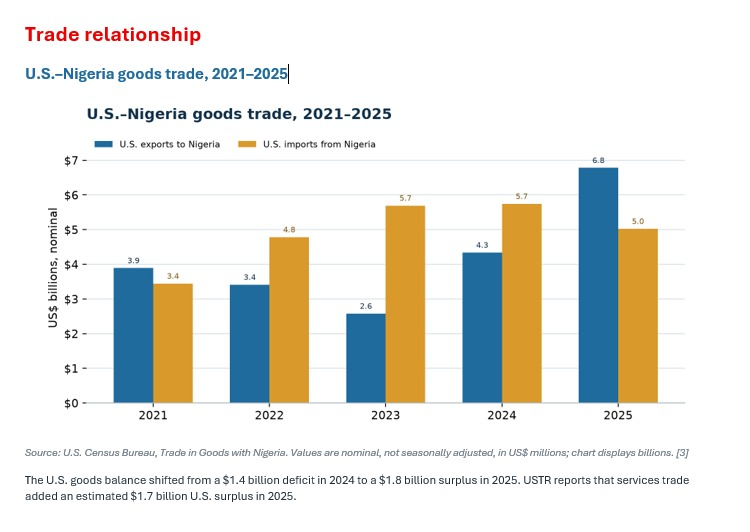
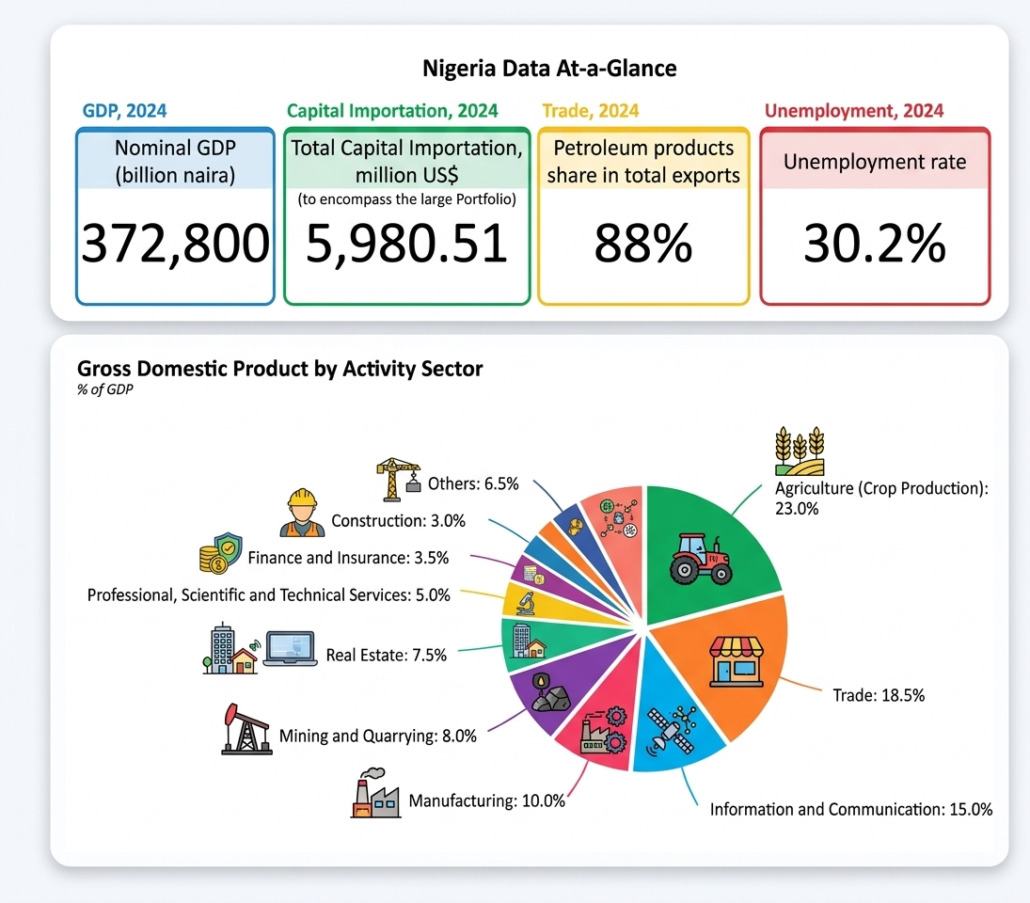
Preserved factsheet content, graphics and key information from the Council's original Trade & Diplomatic Statistics section.
Cocoa, peanuts, cotton, palm oil, corn, rice, sorghum, millet, cassava (tapioca), yams, rubber; cattle, sheep, goats, pigs; timber; fish.
Crude oil, coal, tin, columbite; rubber products, wood; hides and skins, textiles, cement and other construction materials, food products, footwear, chemicals, fertilizer, printing, ceramics, steel.
$56.06 billion (2025 est.) — country comparison to the world: 53. $63.60 billion (2024 revised est.)
Crude oil 80.8%, natural gas, cocoa beans.
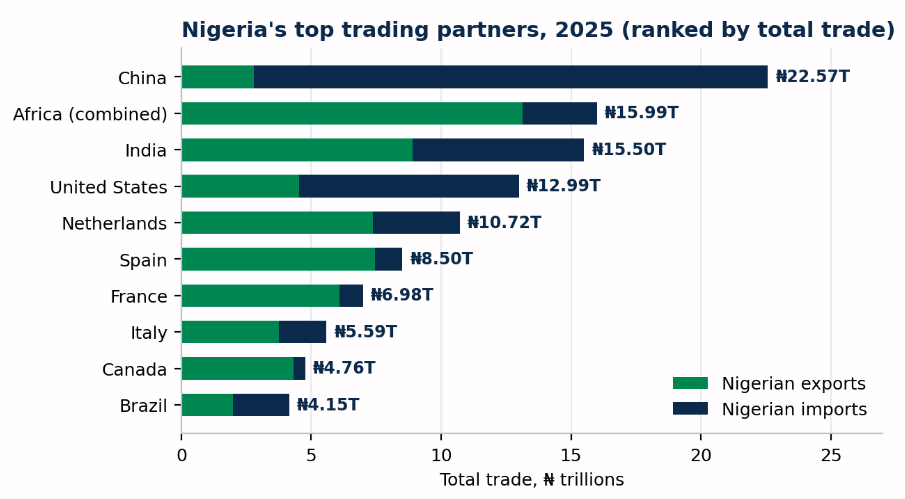
Spain 10.5%, France 9.0%, Netherlands 9.0%, India 11.1%, United States 9.3%, rest of the world 51.1% (2025 est.).
$44.35 billion (2025 est.) — country comparison to the world: 58. $50.90 billion (2024 revised est.)
Refined petroleum, industrial machinery, motor vehicles, wheat, chemical materials.
Source: China 29.4%, United States 12.6%, India 9.8%, Belgium 4.7%, Netherlands 4.9%, UAE 4.2%, rest of world 34.4%. Data compiled from official public trade stats (2025).

Strengthening trade, investment, and economic cooperation between the United States and Nigeria to unlock shared prosperity and growth.