


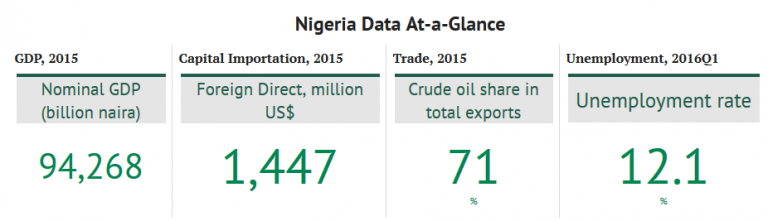

Preserved factsheet content, graphics and key information from the Council's original Trade & Diplomatic Statistics section.
The Gross Domestic Product (GDP) in Nigeria was worth 481.07 billion US dollars in 2015. The GDP value of Nigeria represents 0.78 percent of the world economy. GDP in Nigeria averaged 87.05 USD billion from 1960 until 2015, reaching an all-time high of 568.51 USD billion in 2014 and a record low of 4.20 USD billion in 1960. GDP in Nigeria is reported by the World Bank.
Cocoa, peanuts, cotton, palm oil, corn, rice, sorghum, millet, cassava (tapioca), yams, rubber; cattle, sheep, goats, pigs; timber; fish.
Crude oil, coal, tin, columbite; rubber products, wood; hides and skins, textiles, cement and other construction materials, food products, footwear, chemicals, fertilizer, printing, ceramics, steel.
$97.46 billion (2012 est.) — country comparison to the world: 41. $92.47 billion (2011 est.)
Petroleum and petroleum products 95%, cocoa, rubber.
US 29.1%, India 11.6%, Brazil 7.8%, Spain 7.1%, France 5%, Netherlands 4.3% (2011).
$70.58 billion (2012 est.) — country comparison to the world: 43. $61.63 billion (2011 est.)
Machinery, chemicals, transport equipment, manufactured goods, food and live animals.
Source: World Bank and public trade data as compiled on the original USNBC factsheet page (figures dated 2011–2016).

Strengthening trade, investment, and economic cooperation between the United States and Nigeria to unlock shared prosperity and growth.